Category Archives: Climate

Concerning the Measurement of Global Mean Surface Temperature

Agreement concerning basic definitions, models, and measurement procedures is an objective of good science. Below a brief paper concerning GMST and some questions for Grok. It is left to the reader to ascertain if these answers by Grok are reasonable.

Download pdf:

Question 1.

Consider, for example, the concept of length in a Galilean spacetime. If a sequence of independent, identically distributed measurements X_1, X_2, \ldots ,X_n is made of the length μ of a rigid rod, then, by the central limit theorem, the sampling distribution of the mean \bar{X} of the sequence converges to a normal distribution with mean equal to the mean of the sample distributions. In the absence of bias, the mean of the sample distribution will be the exact length μ. Moreover, the variance of the data can be compared to that expected from knowledge of experimental errors inherent in the details of the measurement process. Unexpected discrepancies can then be evaluated and possible model weaknesses analyzed or unexpected sources of error sought.

Application of this measurement procedure to, for example, the temperature measurement of a homogeneous fluid body in a constant state would quite likely raise few concerns. On the other hand, the surface of the earth is not a homogeneous fluid body in a constant state. If a number of different observers each using different sets of surface points make estimates of the global mean surface temperature, then the sequence of values so obtained does not represent a list of independent, identically distributed random variables and the hypotheses of the central limit theorem do not hold. Rather, this situation is like unto a set of observers, ignorant of the precepts of special relativity, travelling at different, but high, velocities relative to each other, and attempting to ascribe a length to a rigid rod which does not lie in their respective rest frames. Since the model hypothesis of a Galilean spacetime is false, the very concept of length is physically meaningless and differences in length obtained by different observers cannot be attributed merely to technical difficulties connected with the measuring process but rather to the incorrect model assumption of a Galilean spacetime. Due to the relativity of simultaneity, different observers are, in reality, measuring the separations between different pairs of spacetime events. Discrepancies obtained by such observers cannot in this case be ascribed to experimental error which can in principle be overcome by sufficient ingenuity; rather, their explanation requires a fundamental change of philosophy and the recognition that each is measuring a different parameter. In this case, knowledge of the experimental errors involved and of the discrepancies between observers would hopefully lead to a change in the model hypothesis and the discovery of special relativity. This, in turn, would enable the observers to transform their measurements to the rest frame of the rod, thereby yielding consistent estimates of the true rest length.

Unfortunately, the measurement of global mean surface temperature turns out to be far more complex and discrepancies between different observers measuring different distributions cannot be so easily transformed away. Some authors, attribute statistical bias in global mean temperature estimates to an uneven distribution of weather stations. This attribution implicitly assumes that such errors are amenable to correction by more uniform sampling or, perhaps, by better statistical processing. Is there evidence to the earth’s continually temperature distribution does not posses similar mathematical pathology?

Question 2

Let us imagine once more that two observers, with distinct but very large relative velocity, make repeated measurements on the length of the same rigid rod so as to obtain confidence intervals. Assume also that both observers take the utmost possible care to avoid bias in their measurement techniques. After a certain number of measurements their respective confidence intervals for the length will inevitably be disjoint even though both have avoided any procedural bias. This is a simple consequence of the central limit theorem and the fact that, due to relativistic length dilation, the two observers are in effect sampling from distributions with distinct means. Suppose now that one of the observers attempts to reduce this discrepancy by taking additional measurements. No matter how careful he is, or how many measurements are made, the most that can be achieved, will be a reduction in the size of his confidence interval. The problem of disjoint intervals will not disappear. Compare this to a situation in which two climatologists independently measure the average temperature in some region, using different set of sample points, and find a similar unreconcilable discrepancy between their respective results. Since all climatologists are honest, both will dutifully increase the number of sample points in order to obtain, say, a more uniform or, perhaps, less biased sample. Notwithstanding their undoubted honesty, their best efforts and good intentions are doomed to failure. As in the relativistic situation, the distributions which each climatologist samples are distinct, and so the discrepancy cannot be so eliminated by further measurement. In reality, the temperature distribution over the surface of the earth, at any moment, is quite irregular and it seems improbable that two distinct sets of points on the surface taken at different times (or even at the same time) yield samples from the same temperature distribution. In our relativistic analogy, the discrepancy is easily corrected by a transformation to the rest frame of the rod. In the case of temperature, it would seem that one is compelled to make ad hoc assumptions concerning the regularity of the global temperature distribution. What assumptions concerning the regularity of the global temperature distribution have been made?

Question 3

To obtain a confidence interval for the (time) average temperature at a single point, assumptions have to be made concerning the temporal regularity of the temperature at the said point. In fact, the very existence an average temperature underlying the observed temporal fluctuations has to be assumed —after all, not every random variable has a mean. Thus, for the sake of simplicity, let us eliminate this difficulty from the discussion by considering the best possible scenario of a sphere whose surface temperature distribution does not change with time but is purely a function of position. Unfortunately, even in this case there exist temperature distributions which are intractable to any conceivable sampling procedure. Consider, for example, the case of a distribution which is equal to a constant c over the surface of a sphere except for a single point P at which the temperature is a delta function of weight normalized so that the average temperature over the sphere is exactly equal to \beta + c where β is non zero. Then any uniform random sample of points on the sphere would, with probability 1, fail to contain the point P and so yield a sample mean temperature equal to c. Thus, the sample mean would differ from the true mean by the “bias” β which could be any pre-prescribed large number. Infinitely many variants of this construction are possible. Moreover, weaker (physical) versions could be constructed without recourse to the theory of distributions. On the surface of the earth an infinity of sharp temperature jumps occur in such places as the boundaries of icebergs floating in warmer water, at shorelines which are ever shifting and changing and, indeed, at the border of every shadow. Moreover, when temperature is measured, there exists the eminently practical problem of deciding how much weight to allocate to sample points which might be so unlucky as to fall in such hostile and inconvenient places as on an iceberg in the middle of the ocean or at the center of a volcano. The human decisions necessary in such circumstances inevitably lead to a degree of arbitrariness which might well explain the “observed” 0.6 degrees Celsius per century (or whatever it is) temperature increase. Incidently, two icebergs of the same surface area may have considerably different volumes and, hence, correspondingly different thermodynamic contributions but that is another issue entirely.

In summary, there exists the possibility that discrepancies in the measurement of global mean surface temperature may be measure-theoretic in origin, and, therefore not amenable to correction by, say, increases in sample size and quality. Such bias is intrinsic to the situation and independent of the measurements of even the most conscientious climatologist. A finite sample of points cannot, reliably estimate a distribution of unknown form over a set of positive measure. Similarly, surface measurements cannot reliably estimate an unknown volume distribution. How do climatologists handle this problem without relying on an ad hoc model assumption?

© Philip Pennance
Physical Applications of the Stevens’ Classification

Restrictions on admissible changes of scale are often overlooked in science education. Ironically, this topic receives far more attention in philosophy, psychology, and sociology texts than in the natural sciences. In fact, it was the Harvard psychologist S.~S.~Stevens who introduced the now-classic taxonomy of measurement scales, classifying variables according to the transformations permitted under a change of scale. The paper below presents a brief summary of Stevens’ taxonomy and illustrates each category with examples drawn from physics. Download the PDF.

The Dictatorship of (Thermodynamic) Relativism

A parable to illustrate that the same set of data can be compatible with both alleged global warming and cooling simultaneously, ergo, proving that both sides in this nonsensical debate are correct.

“Let all the world know that the power of kings is empty and worthless, and there is no king worthy of the name save Him by whose will heaven, earth and the sea obey eternal laws.” – King Cnut.

In the recently highly anticipated encyclical on the environment, Pope Francis alludes to a conjectured ecological crisis involving global warming.

Pope Francis is not the only pontiff to have addressed the controversial subject of global warming. Legend has it that, for a brief period during the Dark Ages, the Roman Catholic Church was led by a certain Pope Calefacio. His predecessor, the now-emeritus Pope Gelatio, had retired on grounds of poor health.

Calefacio, a chemist by training, was a firm believer in the theory of bovoprogenic global warming—a kind of hell on earth produced by the flatulent emissions of livestock. His conviction was reinforced on the very day of his inauguration, when a spell of climatic instability descended. Some theologians attributed the turmoil to diabolical influence.

Throughout Gelatio’s reign the temperature had remained a steady (16°T). Yet during a period of particularly inclement weather, Calefacio recorded readings of (36°T) and (0°T). Ignoring the cautions of statisticians, he averaged the two values to obtain (18°T) and promptly declared a warming of (2°T).

Risking charges of climate-denial heresy, Gelatio objected that the scale (degrees T) was based on unreliable tree-ring proxies. He proposed instead the excellent ice beer brewed by his own monastic order as a superior thermometric substance, with temperatures measured in the corresponding scale (degrees G). Proxy measurements showed the two scales were related by a square-root function—a transformation that, at least, preserved the thermodynamic ordering.

Under this new scale, the old average of (16°T) became (4°G), while the two recent readings converted to (6^°G) and (0°G), yielding a new mean of only (3°G. Gelatio therefore concluded that the data actually indicated a cooling of 1°G.

In this way the wise Gelatio had inadvertently rediscovered a fundamental truth: the arithmetic mean of a random variable is not preserved under nonlinear transformations.

No records survive of how this theological-thermodynamic schism was resolved, nor whether denialism was ever declared heretical. Indeed, serious scholars now regard the entire episode as a myth, noting the implausibly large chronological gap between the two popes and their earliest mention in texts. Nevertheless, theories of bovoprogenic warming remain in vogue today—notwithstanding the Russian philosopher Soloviev’s warning that the Antichrist would appear as an ecologist, ecumenist, and pacifist.

Like its planetary counterpart, this fable shows how the same pair of measurements can be interpreted as either warming or cooling if a non linear change of temperature scale is used.

by Philip Pennance

References

  1. Philip Pennance, Concerning the Measurability of a Global Mean Surface Temperature, Revised March 30, 2026.
  2. Philip Pennance, Physical Applications of the Stevens’ Classification of Random Variables, March 2006 – Revised April 3, 2026

The Logical Case against Climate Panic

A climate scientist once informed me that “Climatologists do not use the logic of Pure Mathematics.” Indeed he was correct. A recent essay by Viscount Monckton of Brenchley explains how, in his words, “the profiteers who market Thermageddon offend against the principles of formal logic.” According to Monckton,

Logic is the heartbeat of all true learning – the soul of the Classics, the Sciences and Religion. Once everyone studied the Classics, to know that in logic there is a difference between true and false; the Sciences, to discern where it lies; and Religion, to appreciate why it matters. Today, few study all three empires of the mind. Fewer study the ordered beauty of the logic at their heart.

Read Viscount Monckton’s essay

A Nobel Prize For Inanity


Last week, the prison population in England and Wales exceeded capacity. Rather than addressing the main causes of this increase, namely, the abandonment of traditional values and the collapse of the two parent family, the principal concern of the government seems to be that imprisoning more people will increase anthropogenic global warming. Citing “research” showing that carbon emissions within former Home Office bodies , including the prison service, have risen from 28,237 tonnes in 2005-06 to the insignificantly greater amount of 28,925 tonnes in 2006-07, Maria Eagle, Junior Justice Minister, has announced that an increase in the prison population together with changes in “regime facilities”, such as the provision of in-cell showers, have boosted CO2 emissions.

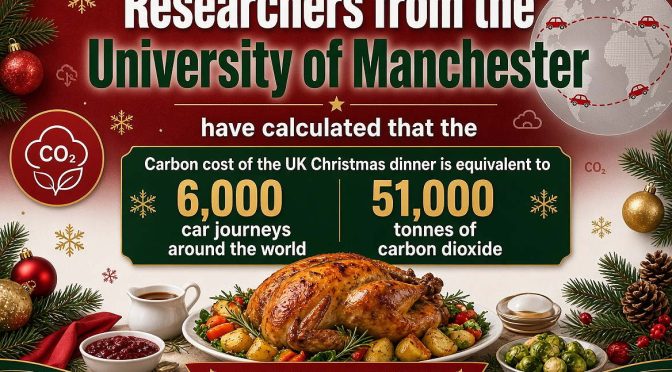
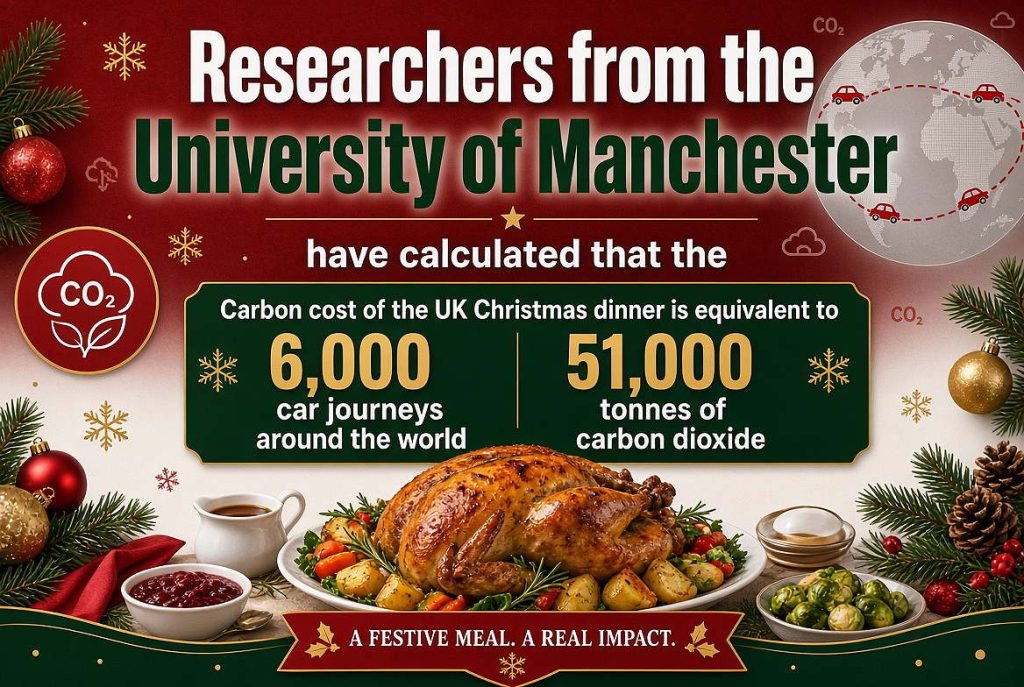
If there existed a Nobel prize for inanity, the scientists behind this ludicrous “research” would surely be in close competition with those at York University who recently calculated the carbon footprint of the average UK Christmas dinner or those who blame livestock for bovoprogenic warming. The Minister’s comments, which lack any common sense, disqualify her from office and illustrate the primitive level to which British education and science have fallen.

Meanwhile, Professor John White, an education adviser to the British government has stated that traditional disciplines such as Math, Geography and History should no longer be taught because they are “middle class creations”. Rather, they should be replaced by topics such as global warming and personal skills, taught via a regimen of “theme or project-based learning”. Professor White’s error is hardly original. The constructivist educational philosophy he espouses is already well entrenched in Britain, and has been since the period of school “comprehensivisation” following the second world war. Generations have already been idiotized —the blind (including Professor White) leading the blind into a rapidly approaching moral and intellectual dark age.

Addendum
The Bishops of London and Liverpool, Dr Richard Chartres and James Jones, are launching the Carbon Fast at Trafalgar Square. They hope to encourage people to reduce their carbon footprint for 40 days.

— The UK  is now an insane asylum.

By Philip Pennance

On the carbon footprint of cranberry sauce

According to Project leader professor Adisa Azapagic:

“Food production and processing are responsible for three quarters of the total carbon footprint, with the largest proportion – 60% – being related to the life cycle of the turkey.

“All stages in the supply chain have been considered, including raising the turkey, growing the vegetables, food storage, consumer shopping, cooking the meal at home and waste management.

“This includes the emissions of carbon dioxide due to energy consumption along the turkey supply chain and the emissions of methane and nitrous oxide generated due to the agricultural activities to raise the turkey.”

The cranberry sauce alone, normally imported from North America, contributes half the carbon footprint related to transport. 

–Filed under: Idiocy

Physicist blames Christians for global warming

b_sphere_all

“Pagan emptiness and fears about nature have led to hysteric and extreme claims about global warming. In the past, pagans sacrificed animals and even humans in vain attempts to placate capricious and cruel gods. Today they demand a reduction in carbon dioxide emissions.” —George Cardinal Pell

The American Physical Society (APS) has joined the junk science bandwagon. According to the abstract of a talk at the April 2007 meeting of the APS, “On failures in education and public policy”, by John Ely of University of Washington, an example of such a failure is

“the end of the world by global warming due to Christian religion forcing family planning money to be withheld from the UN leading to population excess”[sic]

This claim is scientific nonsense. As is well known, planets with no Christian populations such as Jupiter, Mars, and Venus are all simultaneously undergoing temperature changes or exhibiting severe weather. Nevertheless, this author appears to believe that mere Christianity (not CO2 or earthworms or the sun) is the principal motor behind global warming. This would be funny were it not for the fact that some environmentalists regularly come out with statements such as:

Continue reading Physicist blames Christians for global warming →

A Fable of Global Warming

A fable to illustrate that the same set of data can be compatible with both alleged global warming and cooling simultaneously, ergo, proving that both sides in this nonsensical debate are correct.

On a certain planet called X, the average temperature had been a steady 16° X for as long as anyone could remember. During a spell of particularly clement weather, a climatologist from X took two temperature measurements and and recorded the extreme values 0°X and 36. Their arithmetic mean was 18°X – a full 2 degrees X above the long-term average.

Eager for the fame and funding that such a discovery might bring, the scientist quickly drafted a grant proposal outlining a theory of X-kind-induced global warming. The proposal carefully hinted at dire consequences for X-habitants unless immediate lifestyle changes—with potentially drastic economic repercussions—were implemented.

News of the “discovery” appeared in the local newspaper (aptly named The X-PRESS) and was beamed across the galaxy. Before long, a scientist from the distant planet Zeldon arrived to investigate. Unfamiliar with the X scale, the visitor converted the readings using the square-root relation between the two temperature scales. The values 0°X and 36°X became 0°Z and 6°Z yielding a new mean of 3°Z. Noting that the previous average of 16°X converted to 4°Z, the Zeldonian announced that the data showed no evidence of warming—in fact, they indicated global cooling.

A diplomatic incident followed. The Zeldonian suggested that the X-ians’ thermometric scales were poorly designed. In the ensuing exchange, the X-climatologist defended their mercury-based thermometer, noting that its column length varied linearly with temperature and was even used as dental amalgam. The Zeldonian retorted that any fluid producing the square of the temperature in degrees Z was hardly a model of intelligent design. Unmoved, the visitor wrote a competing grant proposal to study global cooling. Meanwhile, on a distant planet in another galaxy, yet another scientist—using a third temperature scale—found no statistically significant change in the average temperature of X and promptly lost tenure for failing to publish.

Like its religious counterpart, this fable shows how the same pair of measurements can be interpreted as either warming or cooling if a non-linear change of temperature scale is made.

© Philip Pennance 01-30-2005

For a more detailed discussion, please see the following pdf: